
The IDEAs and Interact labs are having an “away” day tomorrow. It’s part of our plan to forge bonds between the groups and provide a supportive atmosphere. As part of the festivities, we were entreated to spend no more than an hour creating an A2 collage to illustrate our lives, our research interests, and our influences. Of course, few us spent an hour. Mine is all digitally produced, my temporary housemate’s is digitally produced, and one of the new faculty was caught superimposing herself into a picture with Michael Moore.
As for my own, I chose to produce it on four A4 sheets and try out Apple’s Pages layout software, part of their new iWork package. Using one of their photo journal templates was satisfactory enough, but I found it more difficult to intuitively work with than FrameMaker or InDesign. Perhaps because I’m just more familiar with traditional DTP/layout programs.
It actually proved more difficult than I thought. In the end, I settled on a page about my research, my life in general, and my teaching, with the fourth (which is actually the first page) dedicated to general keywords related to my life. See the final collage pages.
-
17
Mar 05 Posted by Eingang
 0 comments
 -
4
Jun 04 Posted by EingangI had a good meeting with Thufir on May 14th, lasting almost the full allotted hour. This was because I’ve recently had a breakthrough with my MATLAB analysis and can quantitatively evaluate the similarity between different people or different algorithms with my multi-dimensional scaling (MDS) diagrams. I took some output to the meeting which compared my half-baked algorithm against the cosine normalization version. Both use hypernyms, but how they weigh the hypernyms is different. My automated analysis algorithm also produces an MDS cluster diagram as output for each of the data files provided (see anal1ahyper and anal2ahyper).
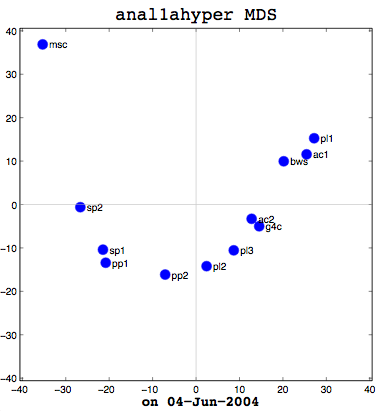
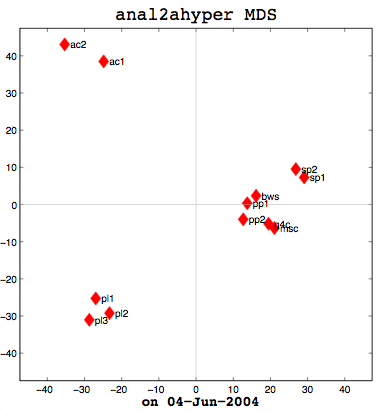
Anal1a, in terms of clumping, doesn’t look very good, at least not anymore. That was not previously the case, but I had revised my algorithm to make it symmetrical as per the insructions of a computing statistician here at the University of Sussex. He claimed that the Procrustes Rotation needed symmetric data and my nonsymmetric data, where Doc1 vs Doc2 didn’t have the same similarity as Doc2 vs Doc1, was not going to work. That change has, I believe, altered the efficacy of the algorithm and things are no longer clumped together as promisingly as they were previously. The clumps should be a two- or three-letter short code followed by a digit. Therefore, ac1 and ac2 belong together. Pl1, pl2, and pl3 belong together, and so on. The clumping is significantly better in the already symmetric cosine normalization algorithm (anal2a). The two speech processing documents are clumped together (sp1 and sp2), all of the Power PC and G4 documents are together (pp1, pp2, g4c), and the three Pine Lake tornado stories are clumped far away from everything else (which is all computer-related) and together on their own. Excellent clumping, in fact. So the hypernym hypothesis looks like, on these short documents, it is working well with cosine normalization.
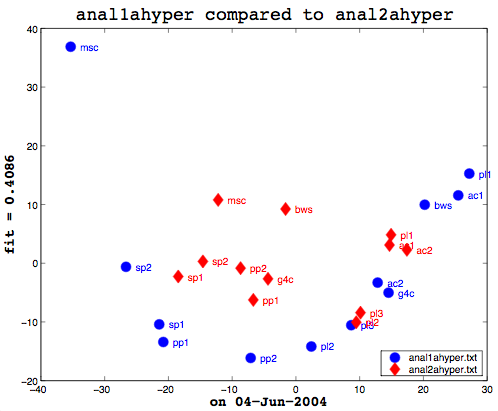
Here’s the final bit of loveliness: comparing one MDS cluster diagram against another. MDS output is mapped to the vector space independently. That is, the same data will produce the same visualization or mapping, but different data is mapped to a different vector space, so you cannot just compare one MDS matrix to another directly. That is where Procrustes Rotation comes in. It applies a series of intelligent matrix transformations, trying to map the second vector matrix onto the source vector matrix. As a side benefit, essential in my case, it always provides a fitness measure to tell you how close the two were. on a scale of 0 to 1. So these two, as you can see (see above image), even after the transformations, were not that close together. As it happens, though, this is not particularly useful information to know. I am currently more interested in assessing how close the two algorithms are to human classifiers.
This recent success gave us plenty to discuss, particularly with respect to metric and non-metric data. The MDS community calls source data metric when the similarity or dissimilarity data is symmetric. That is, the value at row 2, column 1 is the same as the value at row 1, column 2. Classical multi-dimensional scaling (MDS) is designed to only work with metric data. SPSS includes the ALSCAL and PROXSCAL MDS algorithms which can work with non-metric data, but MATLAB’s classical MDS does not because it treats things as Eucledean distances–another reason why I had to alter the Anal1a algorithm. The primary reason I now had metric data for everything, however, was because the computing statistician had told me I needed it for the Procrustes. Hawever, as we were examining my output, it occurred to me that Procrustes did not really care if the data was symmetric, so long as the dimensions of the data were the same (the same number of rows and columns). Which leads us to question whether the application of the method is statistically sensible or not. To that end, I need to track down a new computing statistician and perhaps a mathematician and discuss the process with them. My original computing statistician has retired.
Earlier I said that comparing one machine to another, to see how they fit is not useful information, but what would be interesting is to prepare a matrix of all the possible combinations of human judgements, cosine normalization, and weird formula:
cosine   wrd form.   human
cosine (anal2a)		x
weird formula (anal1a)           x
human                                        x
So that is my task for my next meeting (on the 16th of June). Before then, I need to figure out how to get MATLAB to take multiple tables as data. In SPSS, I could paste in several tables (representing all of the people’s individual data, for example) and it would work with that. That is necessary in order to aggregate the peopel to do the comparison. Onward ho, then! Progress at last!
-
4
Jun 04 Posted by EingangI have to confess to feeling a bit stupid. I have been struggling with MATLAB for weeks now, trying to get it to read in my data files so I can automate my analyses. My data is in a tab-delimited file and looks something like:
Doc1	Doc2	Doc3	Doc4
Doc1	100	76	18	91
Doc2	76	100	22	35
Doc3	18	22	100	65
Doc4	91	34	65	100
This is not too dissimilar from the labelled diagram, part of the MATLAB documentation on data importing. Except that, if you look at the table below it, which describes which functions to use, they don’t have a function with a similar example to their labelled diagram. Early on I thought I should be able to use dlmread, which allows you specify rows/columns for starting points or a range. My idea was just to have a range which excluded the non-numeric troublesome labels. No matter what I did, though, I could not get it to work. It was frustrating, because I could paste the data into the Import Wizard and that could handle the data fine. I wrote people, I researched on the web, and I tried all sorts of things.
Eventually, I came full-circle back to dlmread and experimented by making a small data file with unrelated data in it. That worked fine. So I then copied half of one of my data tables into the test file and tried that. That also worked fine. I copied the whole data table into the test file and used dlmread on it. It worked fine! What was the difference between the two identical data files other than their filenames? When I uncovered the answer to that, I kicked myself. My data files were generated years ago and stored on my Mac OS 9-based laptop. My laptop and the data have since migrated to Apple’s swoopy BSD-based UNIX goodness and that’s the environment that MATLAB runs under. So… Have you guessed the problem? Yes, it was linefeeds! The data files had original Mac linefeeds and MATLAB wanted UNIX linefeeds. D’oh! It just goes to reaffirm that the things you don’t see can really hurt you.
-
Posted by Eingang
I was talking about my recent posters the other day with Teetee/Pi. He was asking me questions about how to interpret Figure 3 which shows the clustered output that results after feeding similarity data into the multidimensional scaling algorithm. I didn’t have a copy of the page handy, so I pulled up the PDF version and happened to notice that the one-page version of my poster, destined for an ordinary sheet of paper, no longer had my name or my e-mail contact address on it. The only thing on it was a pointer to the three-page version of the poster on this web site.
Oops! Oops! Oops!
I was short on time when it was decided that a handout-sized version of information was needed, so I’d had my Sweetie build me the single page and the three-page versions based on the finished poster design. He got a little overzealous about saving space and, well, managed to axe the contact and affiliation information. It was missing off of the three-page version, too.
Alas, I didn’t discover this until after the Open Day, so the damage has probably already been done. Nevertheless, I’ve prepared new versions of both documents with this information intact and added page numbers, where appropriate, to boot.
Live and learn! Don’t be so concerned with the content that you fail to see the forest through the individual trees!
Downloadable Resources:
- A4 (regular page) handout sheet
- 3-page PDF version -
14
May 04 Posted by EingangI was trying to get X11 launching applications from the department’s Solaris server again. As before, I couldn’t immediately get it to work because of “magic cookie” authentication issues. I reviewed my previous notes which pointed to an article at MacWrite.com which might have helped before, but it was suddenly unavailable. The WayBack machine to the rescue. As soon as I had edited my /etc/ssh_config file to include the following information, I was good to go again:
Ciphers blowfish-cbc, aes128-cbc, 3des-cbc, blowfish-cbc, cast128-cbc, arcfour, aes192-cbc, aes256-cbc
Compression yes
ForwardX11 yes
Protocol 2,1
RhostsAuthentication no
RSAAuthentication no
UseRsh noNote: It may be necessary to take out the extra spaces between items in the Ciphers list.
That, of course, assumed I had already had an entry in my ~/.cshrc file to the effect of:
setenv DISPLAY :0.0
Then, I can simply use a variant of the following to, for example, launch dtterm:
ssh -X eingang@machine_name.com /usr/dt/bin/dtterm
MATLAB, unfortunately, doesn’t seem to work at all. It used to generate all kinds of font errors looking for various Sun fonts, but it did launch. Now it launches with all the font errors (see sample below), shows the graphical about box and then we’re in the command line environment instead of the GUI development environment.
Font specified in font.properties not found [ urw itc zapfdingbats medium r normal * %d * * p * sun fontspecific]
Font specified in font.properties not found [ urw itc zapfdingbats medium r normal * %d * * p * sun fontspecific]Note: All the ‘-’ characters appearing inbetween [] above have been changed to spaces to render better in HTML.
I’ve mailed the Mac technical support person to see if they have any ideas as to why it no longer works and how it might be possible to fix the font errors.
-
11
May 04 Posted by EingangBy the end of April, I seemed to be stymied in my quest for an affordable copy of MATLAB that I could run on my local laptop. The university maintains a license pool for the base software plus toolkits. I do have access to run a copy from the license server when I’m on campus. It actually worked off of campus too, when I’d been told it shouldn’t, but that turned out to be a mistake. When I reported it, the firewall was closed to the outside world for requests for the license server. That’s where honesty gets you: no MATLAB accessibility from anywhere with an Internet connection.
I was hoping to snag one of the concurrent licenses for my permanent use and offered even to buy an additional one for that purpose as that would be cheaper. I was told that I couldn’t have one and I should investigate the student version of the software. Unfortunately, the student version is only available to students in taught courses, not Ph.D. research students, so that wasn’t any good. I mentioned to Thufir that I’d been turned down, reportedly by the head of software/hardware procurement within our department. Thufir promised to see what he could do. Then, last week, I received an e-mail last week from the lab manager, the person in charge of the procurement. He offered, if somebody would pay for it, to install an academic version of the software on my university-owned equipment for only £525 (~930 US/780 €). That was just for the base software and not also for the toolkit I need. -
7
May 04 Posted by EingangToday was the Open Day for the Human-Centred Technology group at the University of Sussex. IDEAs , my research lab, is part of the overall HCT group and a major participatant in the organization and presentation of the Open Day event, the first of which was held last year. I was unable to attend or to help out much with the organization as the event fell outside my scheduled university days. It was decided that we needed copious quantities of posters and every Ph.D. student was expected to make a poster about their project. Apparently this was timely as second- and third-year students were also expected to produce a poster for the department.
I spent oodles of time in April designing the look of the poster and then populating it with text. The finished version of the poster looked pretty good in its A1 size (~90cm by 60cm). Designing the poster in the absence of any input and with lots of nice-looking graphics to possibly incorporate led to a poster that was quite dense and text-heavy, although it had a fair bit of white space, too. A week before the event, the Lab decided that we should also have colour handouts to go along with every poster. Just shrinking down my poster from its large A1 size to A4 (regular paper size) resulted in a page that was legible (but not for readers with poor vision) with tiny graphics. The EinSweetie, who had more time, took the original poster and produced a handout version with not quite so much of the text and graphics on it. As a lot of the crucial detail had been cut, we also decided to make a short multi-page PDF version of the original poster text which could be downloaded. The URL was included on the handout sheet.
Doing the poster was very interesting, especially after my longish absence from working on my Ph.D., as it helped remind me of some of the major issues arising out of my research. A look at the big picture is often very helpful in clarifying your position and your journey. My examination or generation of the big picture led to me to realize that I was developing the fingerprints and the methodology for producing them, but then I wasn’t using the notion of the fingerprint itself anywhere after that point — something I’d completely overlooked, being caught up in the minutia of analysis for ages. I was so struck by this and other revelations that I had them make up a second laminated full-page version of my poster to hang in my office to remind me of the big picture. Life is so much improved when you can see where you’re going.
Downloadable Resources:
- A4 (regular page) handout sheet
- 3-page PDF version -
26
Mar 04 Posted by EingangI need some help in using MATLAB and MDS, so I looked to Google to find resources. There seem to be more MDS resources than when I last looked quite some time ago. I found a useful page with links and pointers to MDS-related resources at http://www.granular.com/MDS/. From there, I obtained most of the resources for a pyschology course organized around MDS taught by one of the MDS’s primary researchers Forrest Young. I downloaded all the notes in PDF format and stored them away to browse through. Young is the same researcher responsible for developing the ViSta software (Visual Statistics System), which looks a lot like that Canadian object-oriented, icon-based programming language. I remember looking at ViSta before, but I don’t think it supported doing things like MDS and it hasn’t been recently updated for anything other than Windows.


analysis applications assessment Associate Lecturer awards Brown bulletin collaborative learning communities of practice connectivism CSR design EinCite FirstClass games-based learning gaming gender HCT IDEAs influences intermission learning Mac OS X marking MatLab meeting with supervisor methodology motivation multidimensional scaling networking Open University pedagogy phd process phd tools planetou planning progress qualitative analysis research design Robert and Susan social knowing surveys tasks teaching World of Warcraft
 Document Downloads
- Persist or Die: Learning in World of Warcraft August 8, 2012
- WoW Learning Project as A4 Poster May 2010 June 4, 2010
- Levelling Lifelong Learning: Annual Progress Review June 7, 2009
- The 2008 H810 Interview Presentation August 25, 2008
- HCT Away Day 2005 Collage March 17, 2005
- EinCite Poster As A4 July 14, 2004
- EinCite Project Description July 13, 2004
- Recent Bookmarks
- RHEL-CentOS-MinimalServicesSetup December 19, 2012
- How do I optimize Apache to use less memory? - Powered By Kayako eSupport December 19, 2012
- The Definitive Guide To PHP's isset And empty December 7, 2012
- PHP isset() vs empty() vs is_null() - Virendra's TechTalk December 7, 2012
- Dealing with real-life tragedy in an online world November 9, 2012
What I Write About
analysis applications assessment Associate Lecturer awards Brown bulletin collaborative learning communities of practice connectivism CSR design EinCite FirstClass games-based learning gaming gender HCT IDEAs influences intermission learning Mac OS X marking MatLab meeting with supervisor methodology motivation multidimensional scaling networking Open University pedagogy phd process phd tools planetou planning progress qualitative analysis research design Robert and Susan social knowing surveys tasks teaching World of WarcraftArchives
