• Pigeonholing the Sample

    Photo of many coloured marbles
    Credit: Photo by Marsha Brockman (whodeenee) under an Attribution-NonCommercial-NoDerivs 2.0 Generic license

    Image: Marbles, many marbles. I think I have lost mine in a sample of many marbles.

    I’ve been re-running analyses today on my population of survey responses. I decided to remove some more responses to eliminate some the scatteredness in the population. The majority of responses were from European PvE (player versus the environment) realm players, so I removed the four American realm players and then the five non-PvE players, leaving me with a sample of 30.

    The more I read about sampling, the more confused I am.

    Read the rest of this entry »

     
  • Coding It Wrong on the Right Side of Town

    Photograph of Elephant and Castle on a rainy day in London through rain-streaked window
    Credit: Photograph by Keven Law under an Attribution-ShareAlike 2.0 Generic license

    Image: Photograph of street near Elephant and Castle on a rainy day in London through rain-streaked window

    I’m about halfway through my initial coding of the motivation essays collected last April.  I should have been done this months ago, but I’ve somehow been scared to do it.  I think the big reason behind that is I’m afraid that I’m doing it or will do it incorrectly.  As I am going through and creating codes, I cannot help but feel that I am not always focussing on the motivation issue, which is the primary question. I am generally coding for content or themes I see appearing in the essays.  As an example, an essay may express that the author is more likely to assist someone else if they feel that other person has put some effort and thought into their character.  That is not their motivation for playing, but I have still created a code for it as “assist others”.  When I get to the end and review the list, I will not be able to tell which ones refer to motivation.  Some probably are where a participant has expressed it as a motivation, but other instances, even of the same code, might just be a theme that was raised.

    Read the rest of this entry »

     
  • Quantitative or Qualitative: The Eternal Question

    Doing Qualitative Research: The Book

    Doing Qualitative Research: The Book

    Chapter 2 of David Silverman’s Doing Qualitative Research:  A Practical Handbook (2010, p.16) asks students to consider why they believe a qualitative approach is appropriate for their possible research topics.  In fact, I had not initially considered a qualitative approach at all.  With my background in artificial intelligence, software engineering, and information retrieval, I was tending towards quantitative methodologies.  Information retrieval is very much about calculations and measurement, so that was a natural fit. Wikipedia (2010) describes the qualitative method as one that “investigates the why and how of decision making, not just what, where, when.”

    Read the rest of this entry »

     
  • How To Track People Anonymously Across Multiple Studies

    Image of Zul'Aman Dragonhawk boss fight
    Image: Elsheindra and Team Pink tackle the Dragonhawk Boss in Zul’Aman back in 2008. As a healer, Elsheindra has to make difficult decisions about who will live and who will die, in her role as main healer.  Being a researcher and maintaining anonymity is, I’ve discovered, a lot easier.

    Back in April, I posted my first preliminary study to look at motivation, community formation, and learning in World of Warcraft.  When I was crafting my ethics approval for that study and future studies, I was very concerned with maintaining the privacy of the individuals participating.  The first survey was designed specifically to not require any personally identifiable information, although participants did have the option of giving an e-mail address if they wanted to participate in future studies or if they did not mind being contacted for any follow-up questions.

    A problem arises, however, in following participants across multiple studies.  This is somewhat related to longitudinal studies where repeated observations are collected over long periods of time from the same participants.  The purpose of such studies is to help distinguish actual effects from short-term causes.  However, longitudinal studies aren’t the only time researchers may want to track participants across time and across multiple studies.  That would also be useful to help me build a more complex, detailed picture of participants, even though I intend to be asking different questions in different surveys.

    Read the rest of this entry »

     
  • The Great Date Night Experiment

    When I last saw J, my supervisor, we were disagreeing about how to do the motivational essay coding for my first World of Warcraft survey.. My plan was to go through the essays first to come up with some themes. Then Basil and I would independently code them for theme. My reasoning was I wanted the coding to be free from subjective bias. If two of us agreed independently, then that would be better than just my assessment of the data. J. thought it was unlikely Basil and I would agree, so she set me the “Great Date Night Experiment.” In this experiment, Basil, my partner, and I would sit down on “date night” and test out my theory on a small scale. Basil would read one essay and summarize the main themes or ideas he thought were represented in the essay. I would independently do the same. Then I would report back to J.

    Read the rest of this entry »

     
  • OU in the Cloud: The Q&D Results

    General

    I know people are very curious about the results of my recent E-Mail in the Cloud: An Open University Survey. Time is a bit short for me, so I decided to write up this quick and dirty post outlining the key result. An analysis of the comments people left about why they made the choice they did will be covered in a later posting, as those comments proved to be extremely interesting.

    In a more formal report, the order of detail presented would be different. I’ve started with the results first, as that’s likely to be of interest to most people, and then discussed the methodology, survey deployment, and motivation.

    Read the rest of this entry »

     
  • WoW Survey Design: Putting the Horse Before the Cart?

    I’ve been thinking about the design of the study I want to do on motivation in World of Warcraft. My immediate approach, similar to introductory programming students, was to jump right into the meat of it and start writing survey questions instead of planning. In order to get the data you need in the study, you need to know what questions you want answered. You need to plan. Without knowing that, how can you write survey questions to elicit those answers? So what is it I want to know?

    Read the rest of this entry »

     
  • Metric MDS & Data Delivered

    I had a good meeting with Thufir on May 14th, lasting almost the full allotted hour. This was because I’ve recently had a breakthrough with my MATLAB analysis and can quantitatively evaluate the similarity between different people or different algorithms with my multi-dimensional scaling (MDS) diagrams. I took some output to the meeting which compared my half-baked algorithm against the cosine normalization version. Both use hypernyms, but how they weigh the hypernyms is different. My automated analysis algorithm also produces an MDS cluster diagram as output for each of the data files provided (see anal1ahyper and anal2ahyper).

    Multidimensional scaling visual representation of document similarity using Anal1a

    Multidimensional scaling visual representation of document similarity using Anal2a

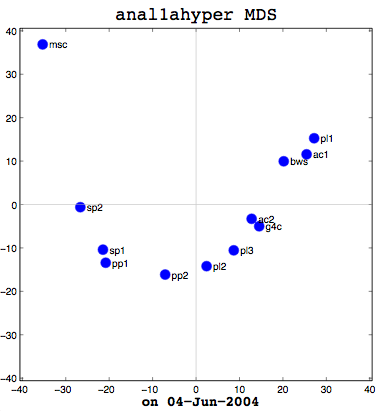
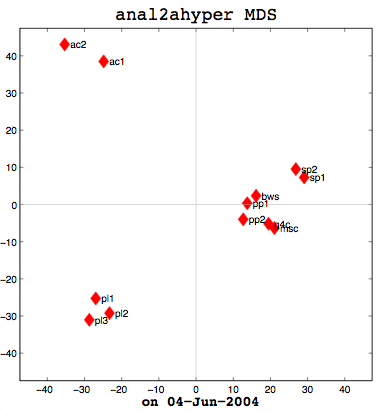
    Anal1a, in terms of clumping, doesn’t look very good, at least not anymore. That was not previously the case, but I had revised my algorithm to make it symmetrical as per the insructions of a computing statistician here at the University of Sussex. He claimed that the Procrustes Rotation needed symmetric data and my nonsymmetric data, where Doc1 vs Doc2 didn’t have the same similarity as Doc2 vs Doc1, was not going to work. That change has, I believe, altered the efficacy of the algorithm and things are no longer clumped together as promisingly as they were previously. The clumps should be a two- or three-letter short code followed by a digit. Therefore, ac1 and ac2 belong together. Pl1, pl2, and pl3 belong together, and so on. The clumping is significantly better in the already symmetric cosine normalization algorithm (anal2a). The two speech processing documents are clumped together (sp1 and sp2), all of the Power PC and G4 documents are together (pp1, pp2, g4c), and the three Pine Lake tornado stories are clumped far away from everything else (which is all computer-related) and together on their own. Excellent clumping, in fact. So the hypernym hypothesis looks like, on these short documents, it is working well with cosine normalization.

    Visual representation of Anal1a mapped onto Anal2a using Procrustes Rotation

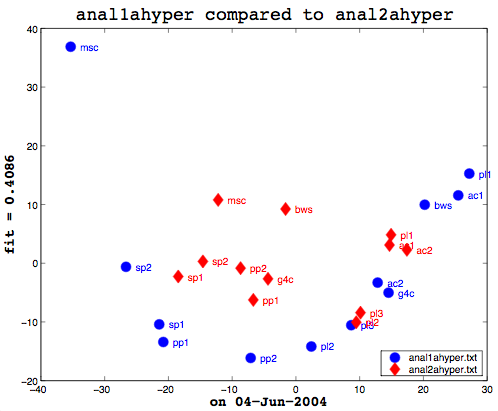
    Here’s the final bit of loveliness: comparing one MDS cluster diagram against another. MDS output is mapped to the vector space independently. That is, the same data will produce the same visualization or mapping, but different data is mapped to a different vector space, so you cannot just compare one MDS matrix to another directly. That is where Procrustes Rotation comes in. It applies a series of intelligent matrix transformations, trying to map the second vector matrix onto the source vector matrix. As a side benefit, essential in my case, it always provides a fitness measure to tell you how close the two were. on a scale of 0 to 1. So these two, as you can see (see above image), even after the transformations, were not that close together. As it happens, though, this is not particularly useful information to know. I am currently more interested in assessing how close the two algorithms are to human classifiers.

    This recent success gave us plenty to discuss, particularly with respect to metric and non-metric data. The MDS community calls source data metric when the similarity or dissimilarity data is symmetric. That is, the value at row 2, column 1 is the same as the value at row 1, column 2. Classical multi-dimensional scaling (MDS) is designed to only work with metric data. SPSS includes the ALSCAL and PROXSCAL MDS algorithms which can work with non-metric data, but MATLAB’s classical MDS does not because it treats things as Eucledean distances–another reason why I had to alter the Anal1a algorithm. The primary reason I now had metric data for everything, however, was because the computing statistician had told me I needed it for the Procrustes. Hawever, as we were examining my output, it occurred to me that Procrustes did not really care if the data was symmetric, so long as the dimensions of the data were the same (the same number of rows and columns). Which leads us to question whether the application of the method is statistically sensible or not. To that end, I need to track down a new computing statistician and perhaps a mathematician and discuss the process with them. My original computing statistician has retired.

    Earlier I said that comparing one machine to another, to see how they fit is not useful information, but what would be interesting is to prepare a matrix of all the possible combinations of human judgements, cosine normalization, and weird formula:

    cosine   wrd form.   human
    cosine (anal2a)		x
    weird formula (anal1a)           x
    human                                        x
    

    So that is my task for my next meeting (on the 16th of June). Before then, I need to figure out how to get MATLAB to take multiple tables as data. In SPSS, I could paste in several tables (representing all of the people’s individual data, for example) and it would work with that. That is necessary in order to aggregate the peopel to do the comparison. Onward ho, then! Progress at last!

     
-->