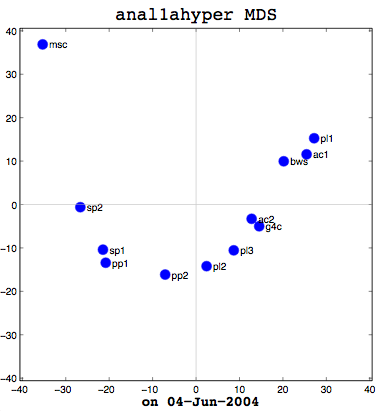
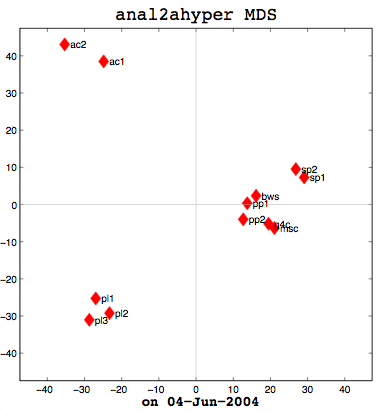
I had a good meeting with Thufir on May 14th, lasting almost the full allotted hour. This was because I’ve recently had a breakthrough with my MATLAB analysis and can quantitatively evaluate the similarity between different people or different algorithms with my multi-dimensional scaling (MDS) diagrams. I took some output to the meeting which compared my half-baked algorithm against the cosine normalization version. Both use hypernyms, but how they weigh the hypernyms is different. My automated analysis algorithm also produces an MDS cluster diagram as output for each of the data files provided (see anal1ahyper and anal2ahyper).
Anal1a, in terms of clumping, doesn’t look very good, at least not anymore. That was not previously the case, but I had revised my algorithm to make it symmetrical as per the insructions of a computing statistician here at the University of Sussex. He claimed that the Procrustes Rotation needed symmetric data and my nonsymmetric data, where Doc1 vs Doc2 didn’t have the same similarity as Doc2 vs Doc1, was not going to work. That change has, I believe, altered the efficacy of the algorithm and things are no longer clumped together as promisingly as they were previously. The clumps should be a two- or three-letter short code followed by a digit. Therefore, ac1 and ac2 belong together. Pl1, pl2, and pl3 belong together, and so on. The clumping is significantly better in the already symmetric cosine normalization algorithm (anal2a). The two speech processing documents are clumped together (sp1 and sp2), all of the Power PC and G4 documents are together (pp1, pp2, g4c), and the three Pine Lake tornado stories are clumped far away from everything else (which is all computer-related) and together on their own. Excellent clumping, in fact. So the hypernym hypothesis looks like, on these short documents, it is working well with cosine normalization.
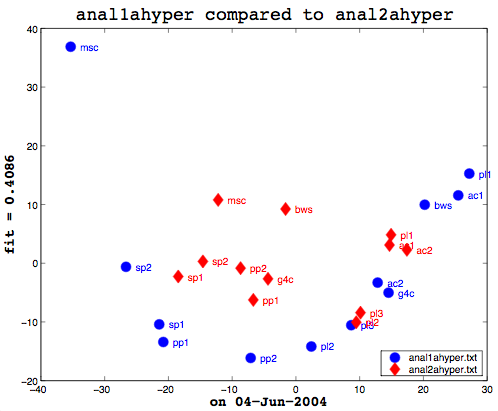
Here’s the final bit of loveliness: comparing one MDS cluster diagram against another. MDS output is mapped to the vector space independently. That is, the same data will produce the same visualization or mapping, but different data is mapped to a different vector space, so you cannot just compare one MDS matrix to another directly. That is where Procrustes Rotation comes in. It applies a series of intelligent matrix transformations, trying to map the second vector matrix onto the source vector matrix. As a side benefit, essential in my case, it always provides a fitness measure to tell you how close the two were. on a scale of 0 to 1. So these two, as you can see (see above image), even after the transformations, were not that close together. As it happens, though, this is not particularly useful information to know. I am currently more interested in assessing how close the two algorithms are to human classifiers.
This recent success gave us plenty to discuss, particularly with respect to metric and non-metric data. The MDS community calls source data metric when the similarity or dissimilarity data is symmetric. That is, the value at row 2, column 1 is the same as the value at row 1, column 2. Classical multi-dimensional scaling (MDS) is designed to only work with metric data. SPSS includes the ALSCAL and PROXSCAL MDS algorithms which can work with non-metric data, but MATLAB’s classical MDS does not because it treats things as Eucledean distances–another reason why I had to alter the Anal1a algorithm. The primary reason I now had metric data for everything, however, was because the computing statistician had told me I needed it for the Procrustes. Hawever, as we were examining my output, it occurred to me that Procrustes did not really care if the data was symmetric, so long as the dimensions of the data were the same (the same number of rows and columns). Which leads us to question whether the application of the method is statistically sensible or not. To that end, I need to track down a new computing statistician and perhaps a mathematician and discuss the process with them. My original computing statistician has retired.
Earlier I said that comparing one machine to another, to see how they fit is not useful information, but what would be interesting is to prepare a matrix of all the possible combinations of human judgements, cosine normalization, and weird formula:
cosine   wrd form.   human
cosine (anal2a)		x
weird formula (anal1a)           x
human                                        x
So that is my task for my next meeting (on the 16th of June). Before then, I need to figure out how to get MATLAB to take multiple tables as data. In SPSS, I could paste in several tables (representing all of the people’s individual data, for example) and it would work with that. That is necessary in order to aggregate the peopel to do the comparison. Onward ho, then! Progress at last!


