
General
I know people are very curious about the results of my recent E-Mail in the Cloud: An Open University Survey. Time is a bit short for me, so I decided to write up this quick and dirty post outlining the key result. An analysis of the comments people left about why they made the choice they did will be covered in a later posting, as those comments proved to be extremely interesting.
In a more formal report, the order of detail presented would be different. I’ve started with the results first, as that’s likely to be of interest to most people, and then discussed the methodology, survey deployment, and motivation.
Table of Contents
The Respondents
533 people participated in the week-long survey. This is broken down visually in Figure 1. Of those:
- 71.1% declared themselves as students (379 people)
- 22.5% declared themselves as associate lecturers, academic conference moderators, or script markers (120 people)
- 3.4% declared themselves as permanent members of staff, either academic or support (18 people).
- 3.0% chose the “other” category (16 people).
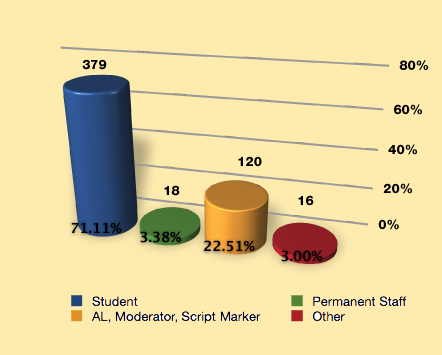
Figure 1: Graph representing numbers and percentages of respondents, broken down by role
Of the 16 others, 7 were alumni. 3 others should probably have been in the AL category but politically considered themselves permanent members of staff. 3 were combinations of ALs/students, 1 was an AL/external contractor, 1 was a student but hoping to become an AL, and 1 claimed to belong to all three categories.
In this quick and dirty analysis, I have not assigned the “others” to appropriate existing categories, so their input is being omitted for the moment. I’ll leave that for a subsequent post.
Key Findings
- Microsoft Live@edu is the preferred choice of very few people overall (11.63%)
- A large number of people don’t know enough to make a choice between the two (36.21%)
- An even larger number of all surveyed respondents (43.52%) would choose Google Apps Eduction Edition.
- If a choice had to be made, Google Apps Education Edition was the most preferred by at least 40% of the respondents of a given role, with the exception of the 16 “Other” respondents.
- If the “don’t care either way” respondents (46) are considered, Google Apps Education Edition would be the choice of 50.28% of all respondents and Microsoft Live@edu 20.26%.
- If Microsoft Live@edu was chosen, it was by a student, far above any other respondent role (14.78% vs the next closest of 6.25%).
The Specifics
The following data table and graphic illustrates the specific choices of different respondents by role. If you’re examining Table 1 visually, bolded cells indicate that the majority of respondents in that row choose that option. For example, in the first row, which is Google Apps Education Edition, the cells for students, permanent staff, and response totals are all bolded, indicating those groups preferred Google Apps Education Edition over the other choices available.
| Student | Permanent staff | AL, moderator, marker |
Other | Response Totals |
|
|---|---|---|---|---|---|
| Google Apps Eduction Edition | 43.5% (165) |
77.8% (14) |
40.8% (49) |
25.0% (4) |
43.5% (232) |
| Microsoft Live@edu | 14.8% (56) |
0.0% (0) |
4.2% (5) |
6.3% (1) |
11.6% (62) |
| Don’t care either way | 7.9% (30) |
11.1% (2) |
9.2% (11) |
18.8% (3) |
8.6% (46) |
| Don’t really know enough to make a choice | 33.8% (128) |
11.1% (2) |
45.8% (55) |
50.0% (8) |
36.2% (193) |
| Answered question | 379 | 18 | 120 | 16 | 533 |
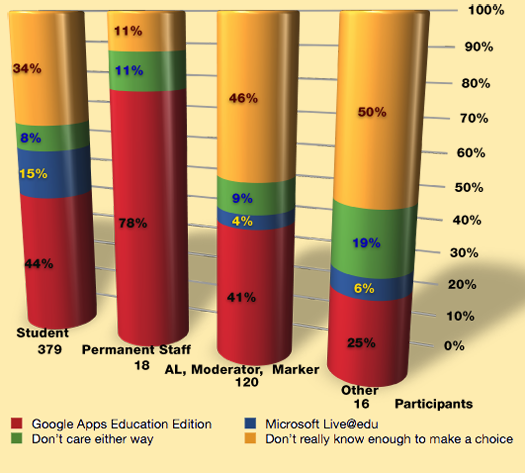
Figure 2: Graph representing the preferences for a system by role.
Figure 2 shows a cylinder for each role in the survey. Each cylinder shows the percentage of respondents who chose Google Apps Education Edition, Microsoft Live@edu, don’t care either way, and don’t really know enough to make a choice with different colours. Google is red, Microsoft is blue, don’t know is yellow, and don’t care is green. While specific numbers aren’t shown on this graph, the total number of respondents in that category is indicated at the bottom, so you can either consult Table 1 for the number of respondents or do a quick calculation yourself.
Caveats
This was an unofficial survey that was designed and released on very short notice. Although I made a good effort to advertise it widely, the number of respondents is relatively low when compared with the Open University’s population of associate lecturers, permanent staff, and students.
While I specifically advertised in places where I knew Open University community members would see the information, I cannot guarantee that everyone who responded was associated with the Open University. I cannot see a reason why external people would participate, but I cannot preclude the possibility.
SurveyMonkey attempts to prevent the same person from completing the survey multiple times. However, that is based on the respondents’ IP addresses. Therefore, if a respondent changed location or has changing dynamically assigned IP addresses, it is possible they could have completed the survey more than once. This could have been avoided by collecting unique Open University identification information for each participant, but that would also have meant needing more stringent data handling and an increased reluctance to participate.
The rest of this post takes a step backwards and considers motivation, deployment, and survey design.
Motivation
According to David Wilson, director of strategic planning in LTS, a choice is being considered between Google Apps Education Edition and Microsoft Live@edu and should be made shortly (in Snowball 36 – November 2009). Students are definitely migrating. A decision is still being made about what to do with e-mail addresses for associate lecturers.
I thought it would be useful to survey interested parties about their preference if they had to choose between the two systems. I was especially interested in obtaining some indication of preference from students, who are guaranteed to be affected. The Business Steering Group, the group responsible for making the decision, will be meeting again soon and I will forward the findings of the survey to them for consideration.
Methodology
The survey itself was very simple, consisting of only three questions:
- Which one of the following roles best describes your main role at the Open University? Your main role will be where you spend the majority of your time or where moving your existing FirstClass e-mail to the cloud will have the most impact.
- Which cloud-based system would you prefer, if you had to choose one or the other? Choices are randomised.
- I confirm that I am associated with the Open University as a student, associate lecturer, permanent staff, or in some other capacity.
The first question was intended to categorize the different respondents by their role at the university. It was recognized that some people have more than one role. They were asked to choose the one where the change would have the most impact. The role was then used to organize the results of the second question.
The second question is the heart of the survey. Respondents were give four choices:
- Google Apps Education Edition
- Microsoft Live@edu
- Don’t care either way
- Don’t really know enough to make a choice
The choices were randomized to avoid any suggestion of bias on the part of the survey giver.
There was also an opportunity to add some brief free-form comments on their choice. From comments in this section and comments received by e-mail, I know many people wanted the ability to say “Neither”. That was not a realistic choice given that one of the two systems will be adopted. That is also why it is worded as “if you had to choose…”
The third question was where the respondent agrees that they are associated with The Open University in some way. The survey is not very useful if it is completed by parties not affected by the outcome.
The survey was prefaced with some brief information about the motivation for the survey and how the survey results would be used. Respondents were also given two links from Google and two links from Microsoft on their respective products. Respondents were also given links to two articles from independent bloggers or education organizations reviewing the two products.
Respondents were assured that the survey was unofficial and no personal details, including computer IP addresses, were being recorded or stored with the survey. They were also assured that I would only be using the data for providing indicative preferences to the Open University and I had not sought or received permission from the Open University to conduct the survey. Contact details by e-mail or Twitter were included.
Survey Deployment
The survey questions were presented and answered electronically via the cloud-based SurveyMonkey poll service. The survey was open between Sunday, November 22nd, and Sunday, November 29th (23:59). Respondents were initially directed to the survey by one of three methods:
- A microblog entry on Twitter with a shortened URL leading to a blog post with a bit more background information on the survey and slightly expanded commentary on the survey than in the actual survey itself. I made several postings throughout the survey period, each time asking others to also pass the information on, which several people did.
- Postings in several FirstClass conferences consisting of a little background information about why I was doing the survey, how it would be used, and how to contact me. The posting included the URL for the a blog post as well as a direct link to the SurveyMonkey survey. The message asked readers to pass the message along to other interested parties, which resulted in it being posted to an unknown number of OUSA and course conferences. I personally made postings in the following FirstClass conferences:
- MCT AL Discussion Forum
- AL Common Room
- Technology Cafe
- Science Chat
- Social sciences Cafe
- R01 Arts Cafe
- R03 Arts Cafe
- OUSA Mac General
- OUSA Open Access
- OUSA Office Applications
- OUSA Linux
- OUSA London
- OUSA Chat
- OUSA Moderators
- A posting was made in the “Lounge” section of Platform, the Open University Community site. The posting was made the 25th of November and Platform claims “0 views”, but that seems to be an error as all threads have 0 views even when they have responses.
Conclusions
Even considering the various caveats in place, I think it is clear there is a strong preference for Google Apps Education Edition if people have to choose between one or the other. Examining the free-form comments, I know there is a belief from many people that e-mail should be kept in-house or that a choice of “none of the above” would have been preferred. Many people are concerned about keeping .open.ac.uk addresses for academic hardware and software purchases. Many people also expressed concern about security and data privacy issues with their e-mail being managed by either Google or Microsoft. I’ll examine these in more detail in a follow-up report.
Thank you to all those who took the time to respond and comment. I would also like to thank those people who reposted or re-tweeted the survey information. As promised, I will be passing this information along shortly to the Business Steering Group who is making the decision.
If you have any comments or questions, please feel free to leave a comment here, message me as @Eingang on Twitter, or e-mail me as mah383 on FirstClass server 2 (tutor.open.ac.uk).
[tweetthis]


